BTC Process Classification – scheme of operation
This functionality uses analysis of sections, functions and dll files used by the executable file under examination (the process being run). It allows to look “deeper” into the structure of a given process. The following features are extracted in this way:
- installation path;
- company name – manufacturer;
- file version;
- product version;
- Copyrights;
- Trademarks;
- section information: .text – executable code:
a) .rsrc – resources such as images, audio, text, etc.;
b) .data – initialization data;
c) .rdata – read-only initialization data; - A list of dll file names that the program uses;
- functions from dll files, used by the program;
- All character strings that carry information about the program.
These features, as a result of the tool’s operation, become described by features such as:
- size;
- entropy;
- The status of writability (or read-only).
Analysis of the above features allows us to extract sets characteristic of each category, which in turn allows us to effectively classify unknown processes into which categories they should belong. The use of a linear machine learning classifier allows more than 92% prediction efficiency.
An example of how a process classifier works
Computer games often use features related to rendering three-dimensional graphics, while instant messaging has features responsible for sending and exchanging information between users. Unfortunately, these sets are not disjoint, i.e. there are cases where one process has a feature or several features observed in other processes from other classes. This leads to the conclusion that it is not possible to make a classification by merely determining a vector of features of the analyzed process and comparing them with an apriori created pattern for each of the analyzed classes.
It is necessary to apply machine learning methodologies. The model produced in this way allows one to conclude that some more complex relationships between functions, dll files, and categories are found, as indicated by the model operating with high efficiency. At the same time, this model, even when tested with a teaching executable file, does not return information that a given process 100% belongs to only one class, but indicates that it also belongs to other classes. It should be mentioned here that there are large disproportions in these indications, i.e. one of the classes is indicated as significantly dominant – which is considered a highly desirable property. The described method of operation of the classifier, and a thorough analysis of the feature matrix lead to the conclusion that the result of the classifier will not be the assignment of the studied process to a class, but the indication of those classes whose features the studied process possesses – with an indication of the percentage degree of inclusion in each class. Thus, for example, despite the existence of the class “Games”, processes that are in fact typical computer games may have characteristics of the category “Communicators”, for example, when in a computer game there is a module responsible for communication between players – this means that the result of the study of such a process will be to assign it to the set labeled “Games” and “Communicators”, with the corresponding degree of membership for each of these classes.
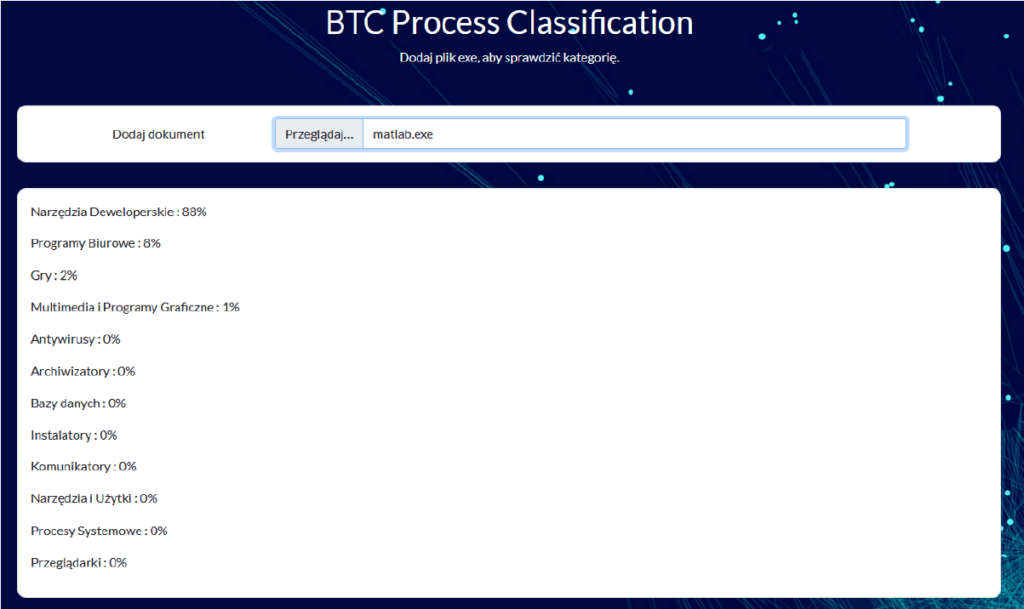
An example answer from the classifier is shown in the figure below. The file “matlab.exe” is a file that runs an environment for mathematical calculations and simulations. From the process classifier, we received information that this process was recognized as belonging to the class “Development tools” – at 88%. Taking into account the set of defined classes, it should be considered that the classifier indicated the most accurate class. In this environment it is possible to program and perform engineering calculations.

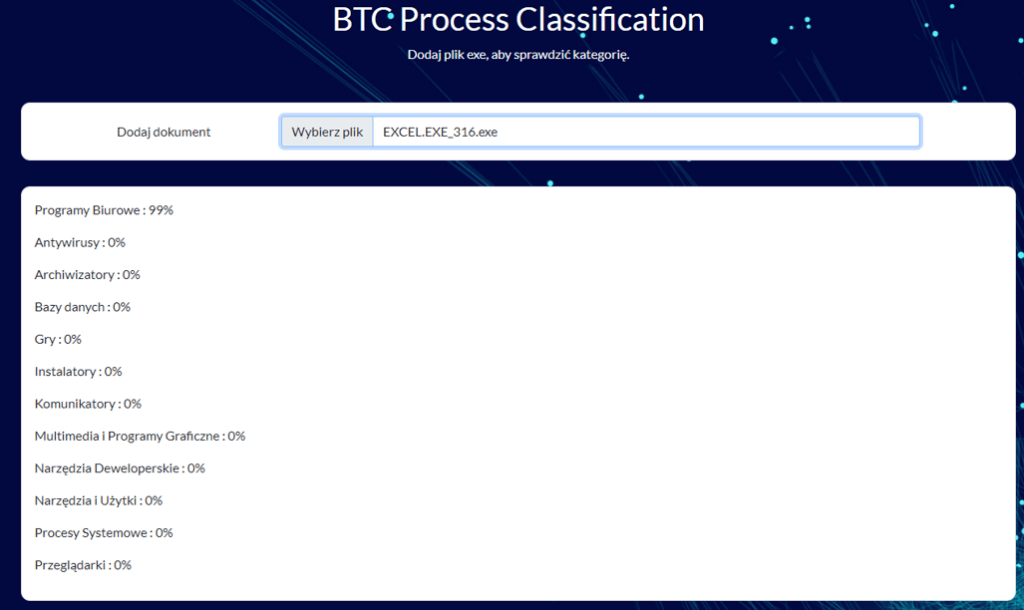
The second image shows the classifier’s response to an Office-related process.

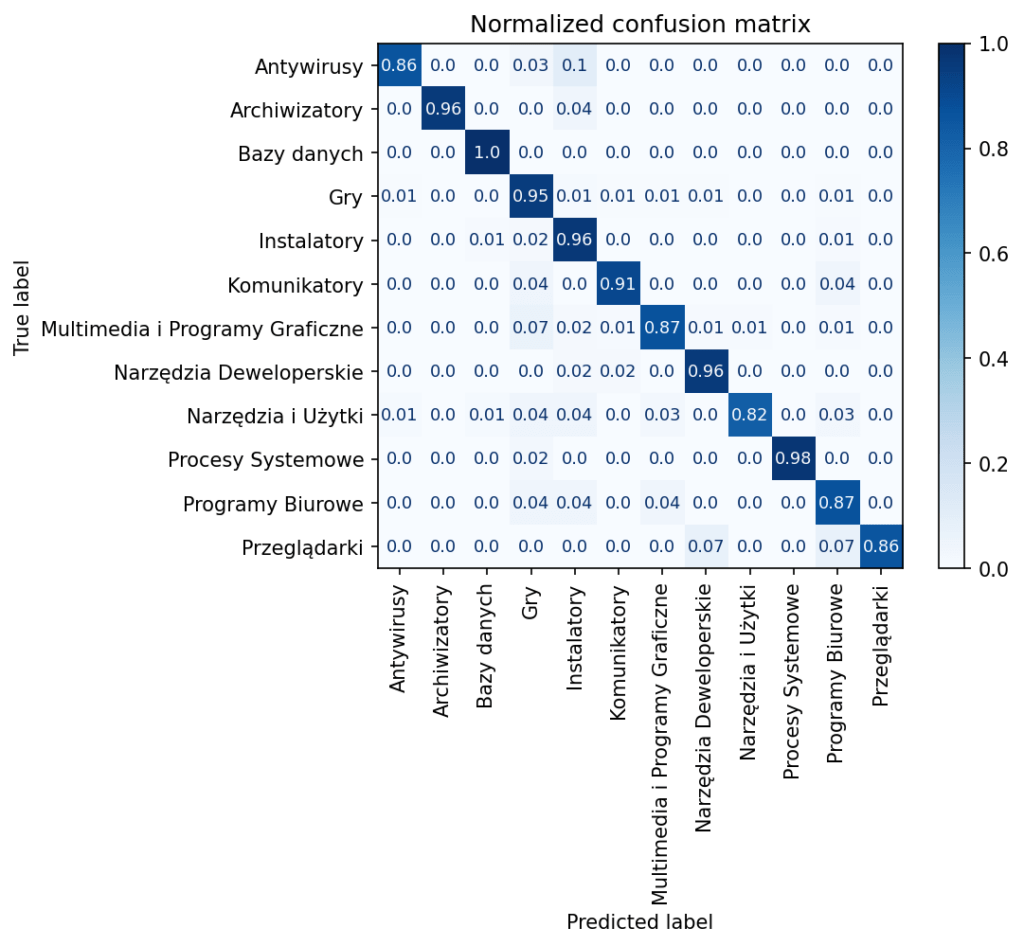
The confusion matrix metric created – shown below – represents the effectiveness of classification for each category with respect to another category; this metric allows us to infer for which class there is the greatest risk of confusion (the value on the diagonal is far from 1), as well as for which categories the model should work most effectively – the value on the diagonal is close to 1.

